Our momentum-crash monitor catches factor rotations, not de-grossing. October 2026 shows the difference.
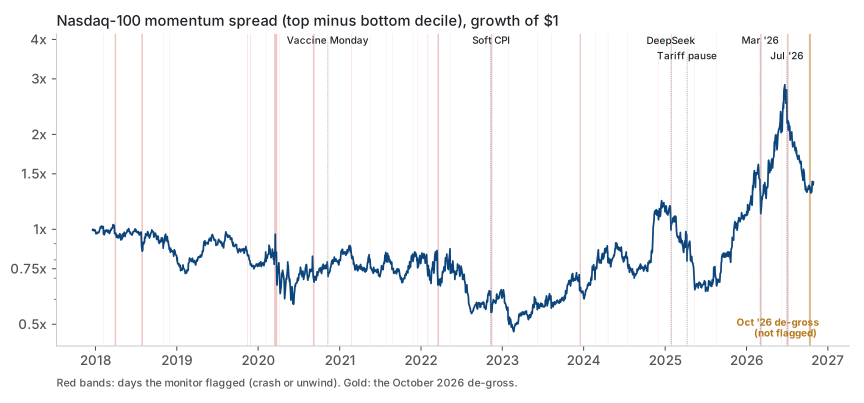
A price-only detector flags the days when crowded winners and losers swap places. It caught DeepSeek, the tariff pause and three 2026 AI unwinds. It missed the October de-gross, and three earlier deleveraging events, for the same reason.
Rayana AI Research · Oct 29, 2026
Momentum is one of the most persistent effects in equity markets, and one of the most fragile. It earns steadily for months, then gives back a large slice in a few sessions when the crowd that owns the winners heads for the exit at once. We built a monitor to see those exits as they happen. This note covers how it works, what it caught, what it missed and why, and the finding that changed how we use it.
What a momentum crash looks like in prices
We have no data on hedge-fund leverage. But a momentum crash leaves a fingerprint in prices: the winners get sold and the losers get bought, at the same time. The gap between the strongest and weakest stocks collapses, often while the index itself moves much less.
The monitor measures that gap every session, on point-in-time index members (no survivorship bias, no look-ahead):
- Momentum is each stock's trailing 63-session (three-month) return, measured at the prior close.
- Winners are the equal-weighted top decile by momentum; losers the bottom decile.
- The spread is winners minus losers for the day.
- The spread is divided by its own volatility over the previous 63 sessions, giving a z-score, so a 2% day counts for more in a calm quarter than in a wild one.
Two flags come out of it. A crash day is a single session at z ≤ −2.5. An unwind is a run where the five-session sum of z-scores reaches −5 or lower: a sustained move rather than one bad print. We run it on the Nasdaq-100 and the S&P 500, from December 2017 to October 2026.
What it caught
On the Nasdaq-100 the monitor flagged 37 episodes over the sample. The biggest read like a history of crowded-trade blowups:
| Nasdaq-100 episode | Spread | Winners | QQQ |
|---|---|---|---|
| Nov 9, 2020: vaccine Monday | −5.9% | −7.0% | −2.0% |
| Nov 10–16, 2022: soft CPI print | −11.7% | +3.6% | +8.4% |
| Jan 27–29, 2025: DeepSeek | −11.8% | −11.0% | −1.7% |
| Apr 9, 2025: tariff pause | −17.4% | +2.5% | +12.0% |
| Mar 3–9, 2026: AI semis and memory | −18.1% | −7.4% | −0.1% |
| Jun 5, 2026: AI semis and memory | −12.2% | −12.0% | −4.8% |
| Jul 1–8, 2026: AI semis and memory | −24.2% | −19.0% | −3.4% |
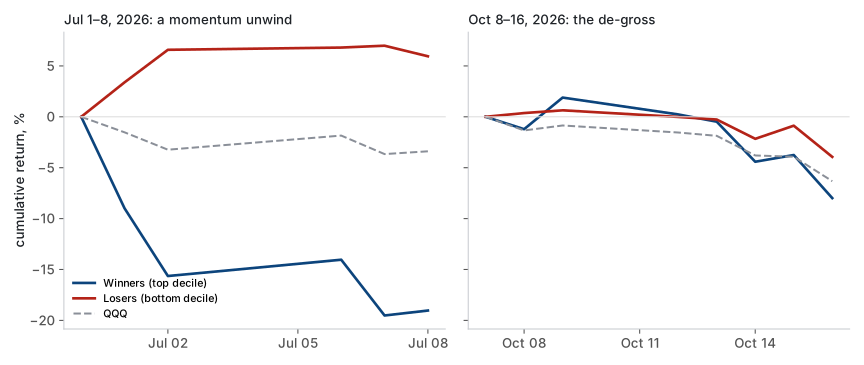
There are two shapes here. On the tariff-pause day and after the 2022 CPI print, the market ripped and the most beaten-down names ripped hardest, so the spread crashed even though the winners went up. In DeepSeek and the 2026 AI unwinds, the winners fell hard while the index barely moved. In the July 2026 episode, Nasdaq-100 winners lost 19.0% in six sessions while the losers gained 5.9%. Both shapes are rotations: money leaving one side of the momentum trade for the other.
What it missed
From October 8 to 16, 2026, hedge funds were widely reported to be cutting gross exposure to crowded AI positions. If anything should have tripped a crowding detector, it was this.
It didn't. The worst five-session reading was −2.2 on the Nasdaq-100 and −1.9 on the S&P 500, well short of the −5 threshold. On the S&P 500 the top momentum decile actually held up better than the index (−0.6% against −1.8%).
The price paths show why. In July the two legs moved apart. In October they fell together: Nasdaq-100 winners lost 8.0%, but the losers lost 3.9% as well, and QQQ fell 6.3%. The spread did give up 4.1%, but against a broad selloff that is ordinary noise, not a rotation. Much of the concentrated damage showed up outside the US, in Korean and Taiwanese semiconductor stocks.
We checked one alternative explanation: that a turbulent summer had stretched the monitor's volatility yardstick, so a real signal read as small. It doesn't hold. Even with a calm-year yardstick, October's five-session reading only reaches −2.8.
October was not a one-off. Looking back, the monitor also stayed quiet through the GME short squeeze (January 2021), the yen carry-trade unwind (August 2024) and the hedge-fund de-gross of February–March 2025. All four are deleveraging events: funds cut longs and covered shorts across the book, and the market absorbed the selling broadly. That doesn't open a gap between winners and losers, so a price-only spread can't see it.
The monitor catches factor rotations and misses de-grossing. Catching de-grossing needs different inputs: a crowded basket against the equal-weight market, semiconductors against the broad index, Korean and Taiwanese markets against the US, or actual positioning data. We're testing the first three; we don't have the last.
The finding that matters more: a crash flag is not an exit signal
The obvious use for a crash detector is as an exit signal: when momentum cracks, step aside. We tested that, and the data says no.
After a crash day, the top momentum decile went on to do better than usual over the next 20 sessions, on average:
| Universe | Crash days | Winners, next 20 sessions after a crash day | Winners, next 20 sessions, any day |
|---|---|---|---|
| Nasdaq-100 | 35 | +4.1% (71% positive) | +3.4% (64% positive) |
| S&P 500 | 45 | +1.7% (53% positive) | +0.7% (58% positive) |
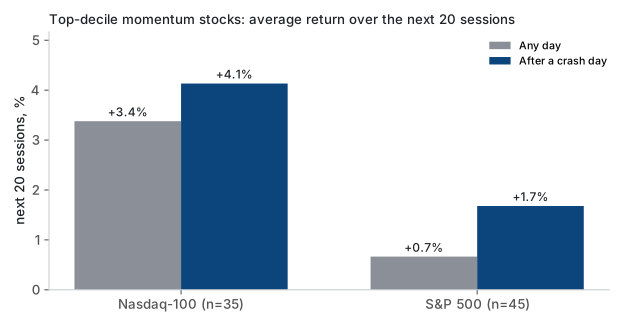
The samples are small and the S&P 500 result is mixed: a higher average, but a lower share of positive outcomes, so a few big rebounds carry it. What the data clearly does not show is the thing an exit rule needs, which is that crash days are followed by more damage. By the time the spread has crashed, much of the forced selling is done, and selling on the flag tends to mean selling near the low. This matches what we found separately with a regime model: signals that light up during stress mark rebounds more often than the start of something worse.
How we use it
The monitor is a diagnostic, not a trading rule. It feeds the daily brief, and it puts a notice on a book's page when a flagged unwind overlaps what the book holds. It doesn't change any weights, and on this evidence it shouldn't.
Three takeaways:
- Factor rotations show up in prices. A winners-minus-losers spread scaled by its own volatility catches them on the day, with no special data.
- De-grossing doesn't. When funds deleverage and everything falls together, the spread stays quiet. October 2026 was the fourth such miss since 2018, and watching for this kind of event needs other measures.
- A crash flag is not an exit signal. Winners did no worse after crash days than on other days, and on average did better.
Method notes: point-in-time Nasdaq-100 and S&P 500 constituents, December 2017 to October 2026 (about 2,200 sessions per index); equal-weighted deciles re-formed daily; momentum measured at the prior close; the spread's volatility uses only the previous 63 sessions. Episodes merge flagged days separated by three sessions or fewer. Forward returns are gross of costs. All results are historical and hypothetical.