We tested the turn-of-month effect on 13 years of QQQ and SPY. It doesn't survive.
The last trading day of a month plus the first three of the next are supposed to carry outsized returns. Since 2014 they have earned about what any other days earned, and they rank below average among every other four-day window in the month.
Rayana AI Research · Oct 30, 2026
The turn-of-month effect is one of the oldest anomalies in finance. Studies in the late 1980s found that a handful of sessions around each month boundary, the last trading day of one month and the first few of the next, earned a disproportionate share of the stock market's return. The usual explanation is money flow: payroll, pension and retirement-plan contributions, and month-end portfolio rebalancing all land in the same few days.
If the effect were still alive, it would be a cheap thing to use: lean a little longer in those days, or schedule rebalancing around them. So we tested it properly, on recent data, with the one control that calendar anomalies rarely get. It doesn't survive.
What we measured
We used daily returns of QQQ (the Nasdaq-100) and SPY (the S&P 500) from January 2, 2014 to October 28, 2026: 3,225 trading sessions.
The turn-of-month window is the last trading day of each month plus the first three trading days of the next. It is defined on the actual trading calendar, so holidays and short weeks shift the window the way they would in practice. These four sessions are about 19% of all trading days.
The question is simple: do window days earn more than other days?
Result 1: no meaningful difference
| Window days, avg daily return | Other days, avg daily return | Annualized, window vs other | t-stat | |
|---|---|---|---|---|
| QQQ | 0.083% | 0.076% | 23.4% vs 21.2% | 0.12 |
| SPY | 0.057% | 0.057% | 15.5% vs 15.4% | 0.01 |
On QQQ the window is marginally ahead, on SPY the two are identical, and neither difference is anywhere near statistically meaningful. A t-stat of 0.12 is what you'd expect from two random sets of days.
Result 2: the control that settles it
A small positive gap on QQQ could still tempt someone. The problem is that the turn of the month is one of many possible windows, and some window will always look good. So we scored every other four-session window the same way, starting anywhere from the eighth-to-last trading day of a month through the eleventh trading day of the next. That gives 18 alternatives.
If the turn-of-month window were genuinely special, it would sit near the top. It doesn't:
- On QQQ it beats 44% of the alternative windows.
- On SPY it beats 33%.
Both are below the middle of the pack. The turn-of-month window earned less than the average alternative on both indexes.
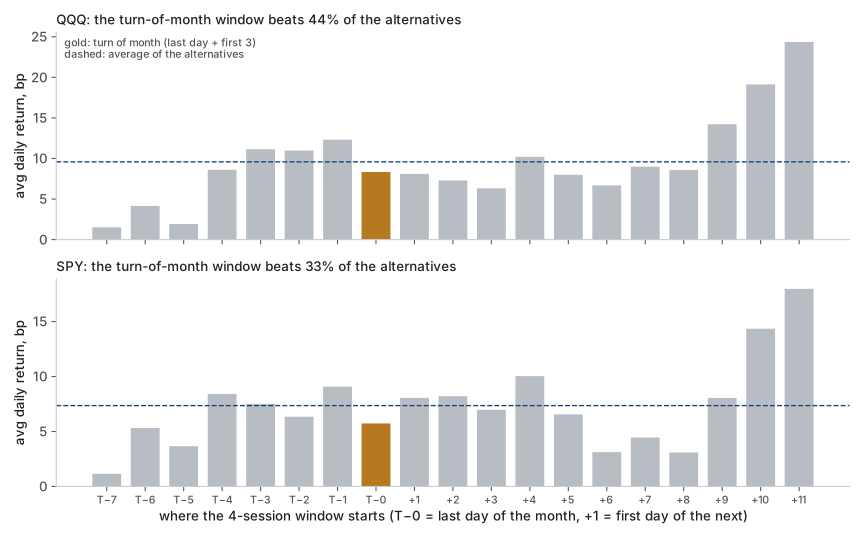
The best window on both indexes starts on the eleventh trading day of the month: 0.24% a day on QQQ and 0.18% on SPY. There is no known reason for mid-month to be special. That's the point of the control: with 19 windows to choose from, one will look impressive by chance. Had we started from the best window and built a story around it, we'd have published a false anomaly.
Result 3: no consistency across years
The effect was positive in 6 of 13 years on QQQ and 5 of 13 on SPY.
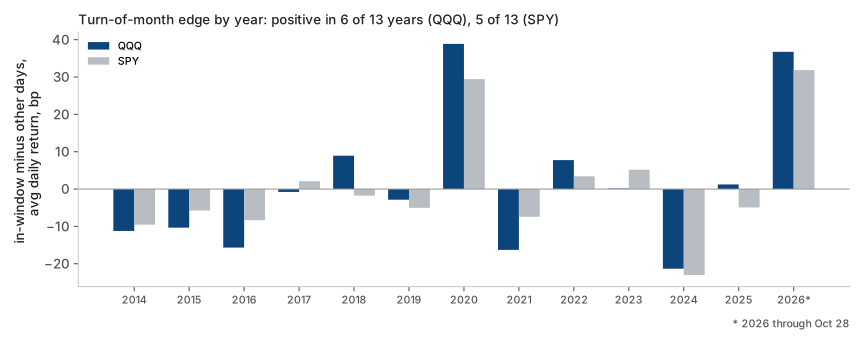
Splitting the sample in half tells the same story. From 2014 to mid-2020 the window underperformed other days on both indexes. Since mid-2020 it has outperformed, but not significantly (t-stats of 0.58 on QQQ and 0.67 on SPY), and most of that comes from two years, 2020 and 2026. A sign that flips between halves, carried by a couple of volatile years, is what noise looks like.
Result 4: it can't be traded
There are two ways to use a calendar effect, and neither works here.
Hold only in the window and sit in cash otherwise. That earned 3.7% a year on QQQ against 18.9% for simply holding, before any trading costs, because it is out of the market 81% of the time. SPY: 2.5% against 13.7%.
Hold all the time, with 25% extra exposure during the window. On QQQ this returned 19.8% a year against 18.9% for buy-and-hold, before costs, which looks like a free 0.9 points. It isn't. The tilt adds about 4.75% to average exposure, and simply holding 4.75% more QQQ every day earns 19.7%. We also applied the same tilt to 500 random sets of days of the same size: the turn-of-month version landed at the 54th percentile on QQQ and the 52nd on SPY. The extra return comes from being more invested, not from the timing.
Is it hiding in bad markets?
One version of the story says the effect matters when markets are weak, when steady inflows are more noticeable. On QQQ, the window did do better on days when the index was below its 200-day average. But the t-stat is 0.37 across about 700 sessions, and SPY shows nothing (t-stat 0.08). Not enough to act on.
The other calendar effects, briefly
We ran the same framework over three other well-known calendar effects:
- "Sell in May" (November–April versus May–October): the wrong sign on both indexes. QQQ earned 18.1% annualized in November–April and 25.0% in May–October.
- The January effect: nothing. QQQ was marginally better in January; SPY was worse.
- December is the only reading that stands out: QQQ averaged −3.9% annualized in Decembers against 24.1% in other months (t-stat −1.31), and SPY 0.3% against 16.8% (t-stat −0.98). That's consistent with tax-loss selling, but it isn't statistically significant, and 13 Decembers is a very small sample. It's the one calendar question we'd revisit.
Why it might have faded
We can't prove why, but the obvious candidate is that the effect became famous. It has been in textbooks for decades, and later studies found it still present into the 2000s. When a predictable flow is widely known, traders get in ahead of it, and the return moves earlier or disappears. Our sample, 2014 onward, is after that era.
Takeaways
- The turn-of-month effect is not visible in QQQ or SPY since 2014. Window days earned about the same as other days.
- It ranks below average among same-size windows. Compare a calendar effect against every window you didn't pick, not just against "other days". Without that control, the eleventh trading day would look like a discovery.
- Tilting toward it adds nothing beyond its extra exposure. It ranks in the middle of the same tilt applied to random days.
- December is the one calendar reading worth watching, and it is still not significant.
Method notes: daily total returns of QQQ and SPY, January 2, 2014 to October 28, 2026 (3,225 sessions). Window = last trading session of each month plus the first three of the next, defined on the trading calendar. t-stats are Welch's two-sample test of window days against other days. The alternative-window comparison scores every contiguous four-session window starting from the eighth-to-last session of a month through the eleventh session of the next. Regime split uses each index's 200-day moving average. Results are gross of costs unless stated. All results are historical and hypothetical.